Grafana plugin
IoT Open is a great platform to collect and organize data from all kinds of IoT subsystems. The data is then easily integrated with other systems to handle the data. One example of this is Grafana that is a very competent product for visualization of the collected data.
The Grafana plugin is a Data source to Grafana to get data from IoT Open. It is very easy to use and this is a small guide to get you started.
News
In the plugin for version 7.x.x of Grafana we have added some nice new features. The first is that you know gets help to choose the right metadata in the filers since they are prefetched from IoT Open. This makes it much easier to investigate what metadata are available and also what their values are.
Another major new function is that when representing data from IoT Open as table data. There is an option to include metadata in the dataset as well. This makes it easier than before to for instance place telemetry on a map.
The plugin as well as Grafana 7 i quite new, so please let us know about your experiences.
Pleas observe. Since the IoT Open plugin is not signed by Grafana you need to set the following in the config.
[plugins]
allow_loading_unsigned_plugins=iotopen-datasource
See more here
Installation
If you have the plugin installed and configured already, skip to usage.
The installation is easy. It you have a Grafana running you can install it there, if you want to test it you can spin up a Grafana instance using docker.
Docker
If you don't have a Grafana installation you can easily start one using Docker.
$ docker run -p 3000:3000 \
  -e "GF_INSTALL_PLUGINS=https://github.com/IoTOpen/grafana-datasource-lynx/archive/2.2.1.zip;iotopen-datasource" \
  -e "GF_PLUGINS_ALLOW_LOADING_UNSIGNED_PLUGINS=iotopen-datasource" grafana/grafana:latest
Manually in existing Grafana
- Download the plugin zip file from here;(Grafana version > 7.x.x) or here(Grafana version < 7.x.x)
- Unzip into grafana plugin directory (defaults to
/var/lib/grafana/plugins) - For Grafana 7.x you need to set a variable
allow_loading_unsigned_plugins= iotopen-datasource, see more here - Restart Grafana to load plugin
Configure
- Acquire an API-Key for the integration (guide)
- Enter settings in grafana (see below)
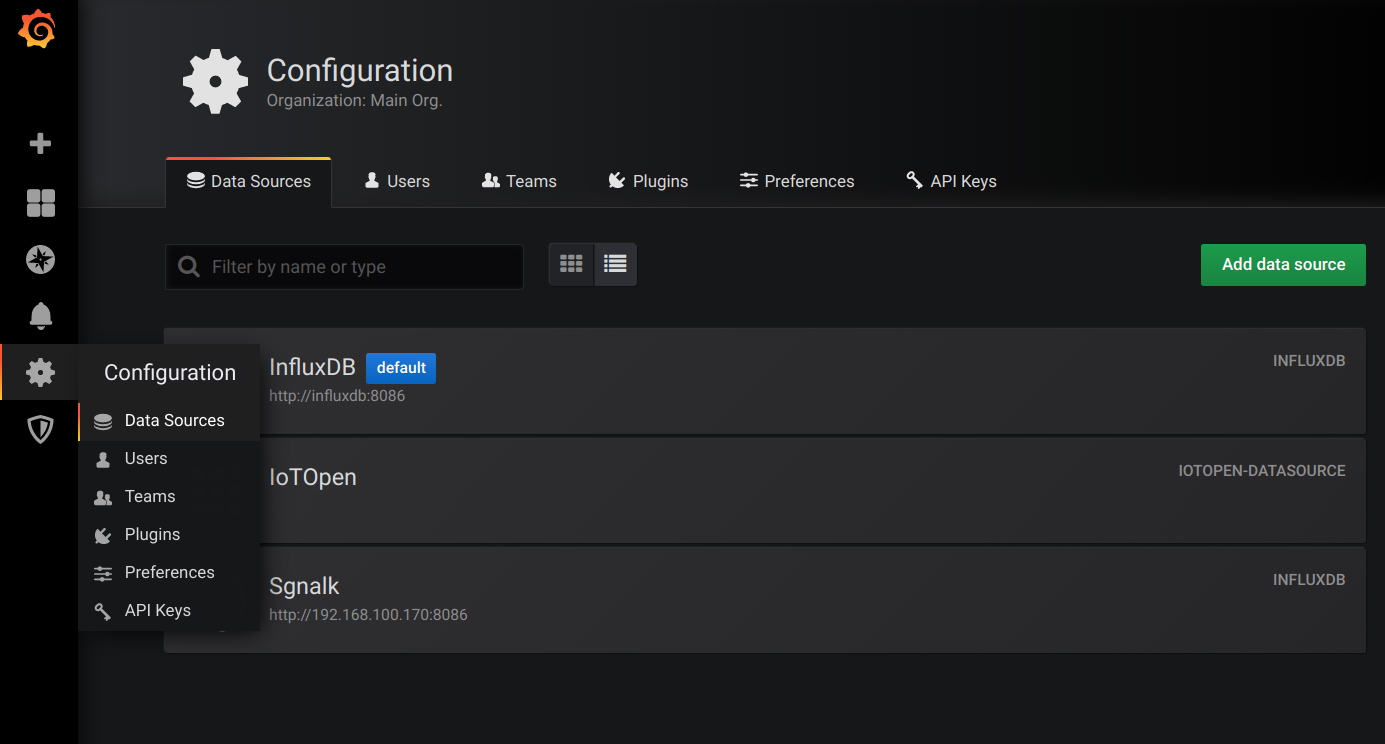
Open the data source settings page.
Enter the url to Lynx (E.g. https://lynx.iotopen.se) and the API-key you created before.
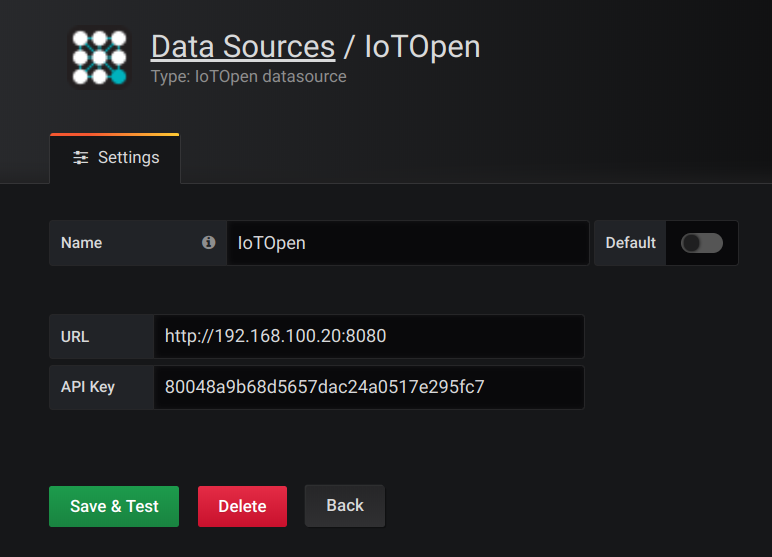
Click on "Save and test" to verify the settings.
Usage
Create your first dashboard
Click on the plus sign in the margin and choose create dashboard. An empty dashboard is created with one panel. Click on "Add Query" to create your fist query. In the Query dropdown, choose you IoT Open data source.
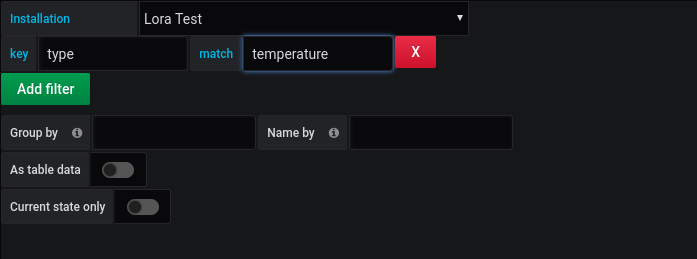
Select the installation you want to work with in the installation dropdown, and then it is time to work with the filters.
If you don't use any filter, all functions of the selected installation will be show in the graph. This is not likely what you want since there might be all sorts of different data.
In the example below there are one filter on type that limits to data of the type "temperature".
Filters
You can have any number of filters and they are limiting the results. In the filters you kan use any metadata to match the functions.
| Key | Example | Wildcard (*) |
|---|---|---|
| name | Temperature Bedroom | Yes |
| type | temperature | No |
Then you can also use any metadata that you define on the function and in the metadata, wildcards can be included.
We use these functions as an example. These are configured in Lynx.
| Key | Value | Note |
|---|---|---|
| name | Temperature Livingroom | Mandatory |
| type | temperature | Mandatory |
| room | Livingroom | Optional metadata |
| floor | 1 | Optional metadata |
| Key | Value | Note |
|---|---|---|
| name | Temperature Kitchen | Mandatory |
| type | temperature | Mandatory |
| room | Kitchen | Optional metadata |
| floor | 1 | Optional metadata |
| Key | Value | Note |
|---|---|---|
| name | Temperature Bedroom 1 | Mandatory |
| type | temperature | Mandatory |
| room | Bedroom 1 | Optional metadata |
| floor | 2 | Optional metadata |
| Key | Value | Note |
|---|---|---|
| name | Temperature Bedroom 2 | Mandatory |
| type | temperature | Mandatory |
| room | Bedroom 2 | Optional metadata |
| floor | 2 | Optional metadata |
| Key | Value | Note |
|---|---|---|
| name | Temperature Bedroom 3 | Mandatory |
| type | temperature | Mandatory |
| room | Bedroom 3 | Optional metadata |
| floor | 2 | Optional metadata |
| Key | Value | Note |
|---|---|---|
| name | Temperature Livingroom | Mandatory |
| type | temperature | Mandatory |
| room | Livingroom | Optional metadata |
| floor | 1 | Optional metadata |
Assume we also have the same functions but for Humidity and Co2. Even though it is a small installation the number of functions starts to increase. So, move on to visualizing.
To generate a graph with all temperatures on the 2nd floor.
| Key | Match |
|---|---|
| type | temperature |
| floor | 2 |
A graph with the temperatures in all bedrooms
| Key | Match |
|---|---|
| type | temperature |
| room | Bedroom* |
A graph with Co2 in the whole house
| Key | Match |
|---|---|
| type | co2 |
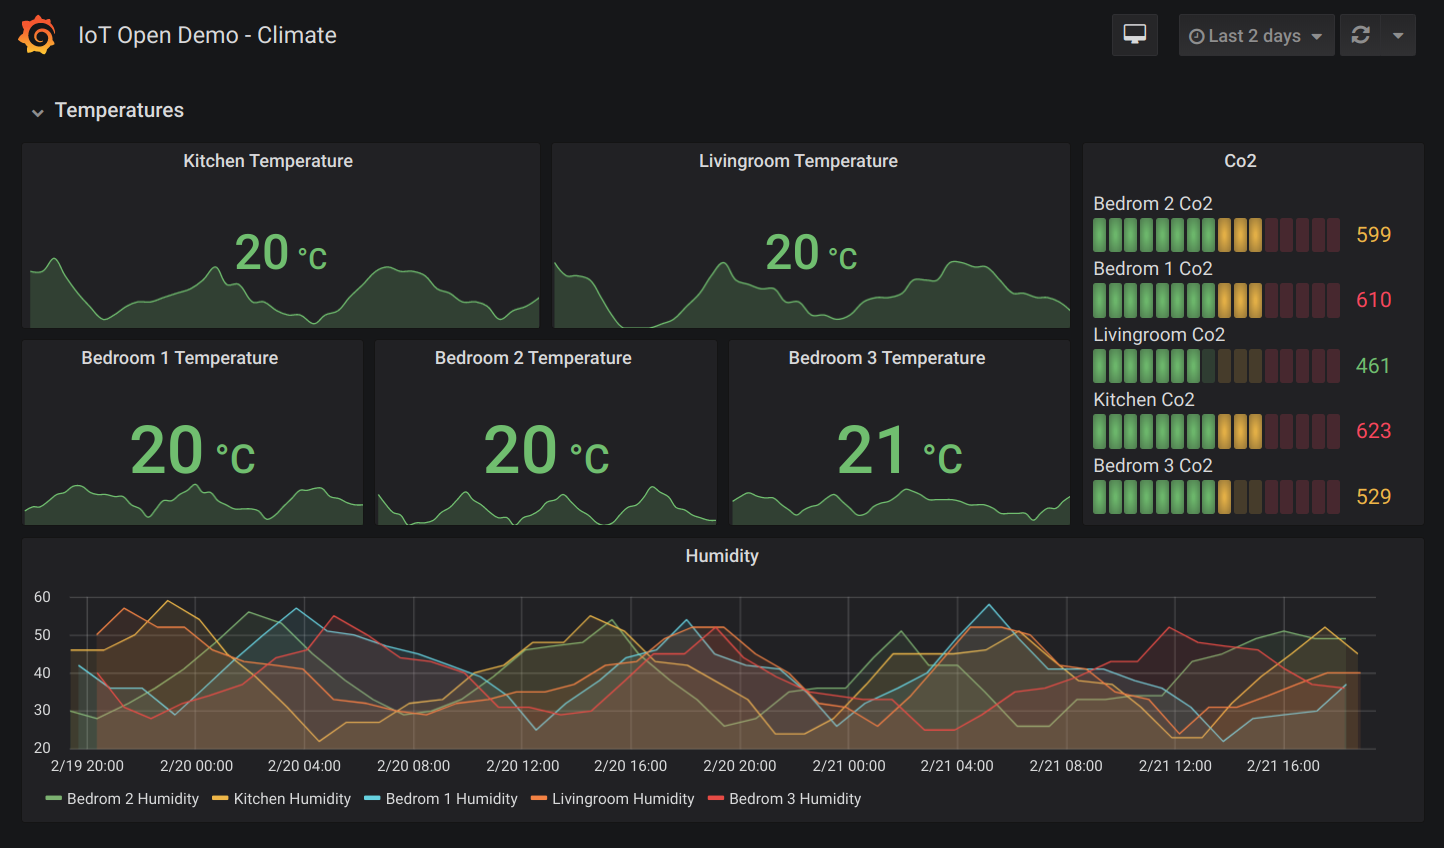
The possibilities are endless.
Here is an example of a dashboard using the devices above.
Advanced options
In the query there are some more advanced features than just filter data via filters.
Group by: With this function you can merge data series from different sources, by grouping them on something common. The default is to group by the Lynx function id so that each function gets its own representation in the graph.
Name by: Default the name in the graph is from the "name" field of the function, but you can use any metadata here. Try topic_read to see values by their mqtt-topic or maybe create your own metadata in Lynx, e.g. grafana_name and use that one.
As table data: Returns the data as a table as required by some Grafana plugins.
Message from and linked with (only on table data): These fields is a specific function that can be used to combine data from different sources in the table mode. This function was especially developed for positional data but might have more areas where it might be useful. A standard data record in Lynx have a timestamp, value, and a msg field.
Now consider this.
| Time | Name | Value | Msg |
|---|---|---|---|
| 2020-03-24 09:48:28 | Temperature | 23.2 | |
| 2020-03-24 09:48:28 | Latitude | 56.19 | u3gp9mcfgnmm |
| 2020-03-24 09:48:28 | Longitude | 15.53 | u3gp9mcfgnmm |
We have three metrics with different data, they are all separate measurements but are related. We might want to combine these values to make is possible to show a temperature combined with a location.
In some subsystems (e.g. Lora) the Msg field for latitude and longitude is actually just one data point consisting of two values is marked with a geohash in the message field. This geohash might be used for positioning of the temperature if we could get it combined with the temperature.
This is where the "Message from" feature comes in handy. The "Linked with" field defaults to device_id and there is in most cases no need to change that.
If we create a query wit the following parameters:
key: Type, match: temperature
As table data: true
Message from: longitude
Then we will get the temperature with the msg from longitude, like:
| Time | Name | Value | Msg |
|---|---|---|---|
| 2020-03-24 09:48:28 | Temperature | 23.2 | u3gp9mcfgnmm |
That will then make it easy to display the temperature on a map using the geohash from latitude.
More reading
There is a lot you can do with Grafana. You can build very impressive dashboards. There are lots of Grafana resources and tutorials on the Internet. Use a search engine to get you started.
Share
If you created a cool dashboard or made some smart solution. Please let us know about it!